Cardiograph
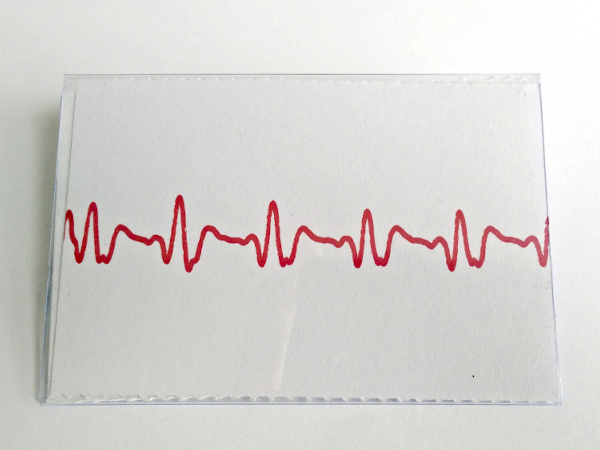
This is a write-up for Cardiograph, a social/technological experiment I ran as part of Culture at Work's event Science: A Body of Facts. Each entrant to the event had their cardiac activity measured by a homemade ECG and drawn in real-time on an ID badge that they wore throughout the event.
For a long time, I'd wanted to do something interesting with ECGs (as opposed to EEGs as in Project Brain or Mind Music). For one thing, the collection and processing on ECGs is much less complicated, and for another, people feel a much more direct connection to their heartbeat than their brain activity; they can feel it, manipulate it fairly easily, and it has significant and obvious health implications.
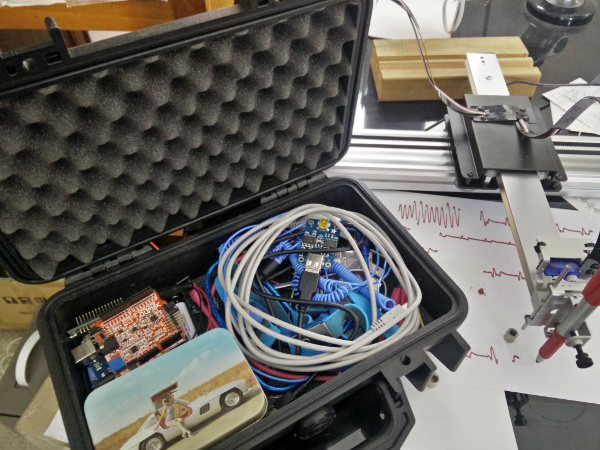
To that end, I'd bought an Olimex EKG-EMG shield, basically a glorified differential amplifier with a huge gain and some filtering. The thing is super cheap, pin-compatible with Arduino, and works great with a little fiddling and smoothing on the software side. It comes with an example Arduino sketch which I used to stream the data over USB serial to my computer.
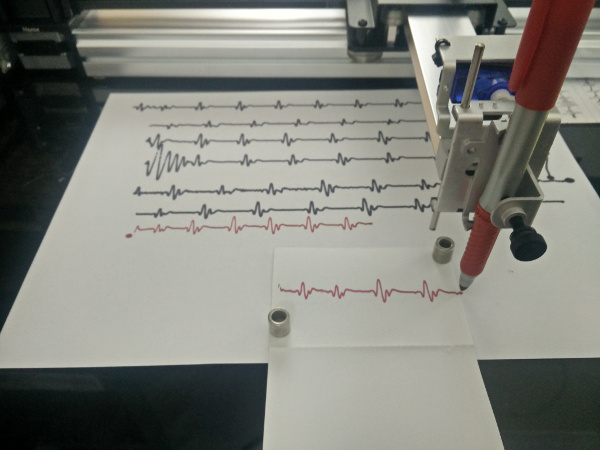
However, while I had the data, I didn't really have an application other than just gawking at my heart rate. The perfect opportunity presented itself when I got a chance to play with my friend Joseph's AxiDraw plotter. I used it for a tech demo with Scrawl, which gave me a pretty good idea of its capabilities. It turns out to be very easy to interface with via USB serial.
These two pieces together gave me the idea to make an ECG that would actually draw on paper. Although modern ECGs use digital displays and have fancy built-in analytical functions, the original ones were completely analogue: just some large electromagnets, conductive string, and a photographic plate. Reproducing this using the combined powers of modern digital amplifiers, high-precision stepper motors and an overpriced laptop seemed delightfully anachronistic.
I wrote the code entirely in Rust, a language I'd experimented with before but never built an entire project in. It was very nice to use compared to C, and extremely fast compared to Python – all up a good fit for the problem space of "low-level code that doesn't make you wake up in the night thinking about memory bugs".
Since I had to manage the plotter and ECG at the same time, I needed a way to manage concurrency. I could have used threads, which, at least in Rust, are moderately well-behaved. However, I'd heard a lot of interesting things about Tokio, a kind of Nodejs-style event driven programming framework. It tries to do a lot and, although the final code was pretty neat, I'm not sure the burden of the extra complexity was worth it.
The code itself needed to do three things: process the input from the ECG, turn that into smooth drawing commands for the plotter, and manage the plotter's command queue (too many commands would make it lag behind the ECG, too few and it would stutter while waiting). Of these, the input processing was the only easy one; I just did a rolling average of the ECG values which acted as a simple low-pass filter and got rid of basically all of the noise.
Managing the command queue wasn't theoretically hard, just very annoying in practice. The plotter itself was actually quite well-behaved; it would send an OK in response to a command that it had received, and if you filled up the queue it would wait until the queue had space before sending OK. I just filled up the command buffer on start, then sent a new command every time I got an OK. I say just, but this was really tricky to get right.
However, that was nothing compared to the difficulty of figuring out the right drawing commands to send. The plotter only really accepts commands like "move x distance over y time", and if you make the distance too high, or the time too low, the motors will skip or shudder. And it's not just velocity, you have to think about maximum acceleration, and maybe even jerk.
With this, I had entered the dark and scary world of control theory. Too much acceleration or velocity and I got jerky, inaccurate movement. Too little and the plotter couldn't adjust fast enough to keep up with the ECG, leaving it oscillating wildly back and forth.
Truthfully, the right answer to this would have been to sit down for a week or two with some serious reference material, learn enough about control theory to really get a sense of the fundamentals of the problem, figure out how to apply that to the real-time inputs I was getting, maybe finally get good at differential equations... Anyway, I didn't do that. Instead, I wrote something that felt like roughly the right idea and tuned it until it seemed to work well enough. Some day, control theory, I'll come back for you.
Ethically, it's worth mentioning that this ECG has very little medical validity. While it does definitely show a reliable signature generated from cardiac electrical activity, it's not a medical instrument, and unlikely to be useful for diagnosis unless you have a really obvious problem. The setup is just one lead (Lead I) compared to the 12 on a real ECG, and with the layers of smoothing and cowboy control theory, the waves end up squished at the extremes, making small fluctuations look larger.
One other point worth mentioning is safety. When you're putting electrodes on either side of someone's chest it's really important not to accidentally put high voltage through them. That means you need isolation, and almost all of the ways to do it for a serial device are expensive, inconvenient, or don't actually work. After a lot of research I can safely say that the only decent option for less than many hundred dollars is Adafruit's USB Isolator. Most USB isolators have different ratings for data and power, for example Adafruit's is 5kV/2.5kV but a lot of the cheap ones on eBay were 5kV/1kV. I don't understand this; surely someone getting zapped to death doesn't care which wires the electricity came through?
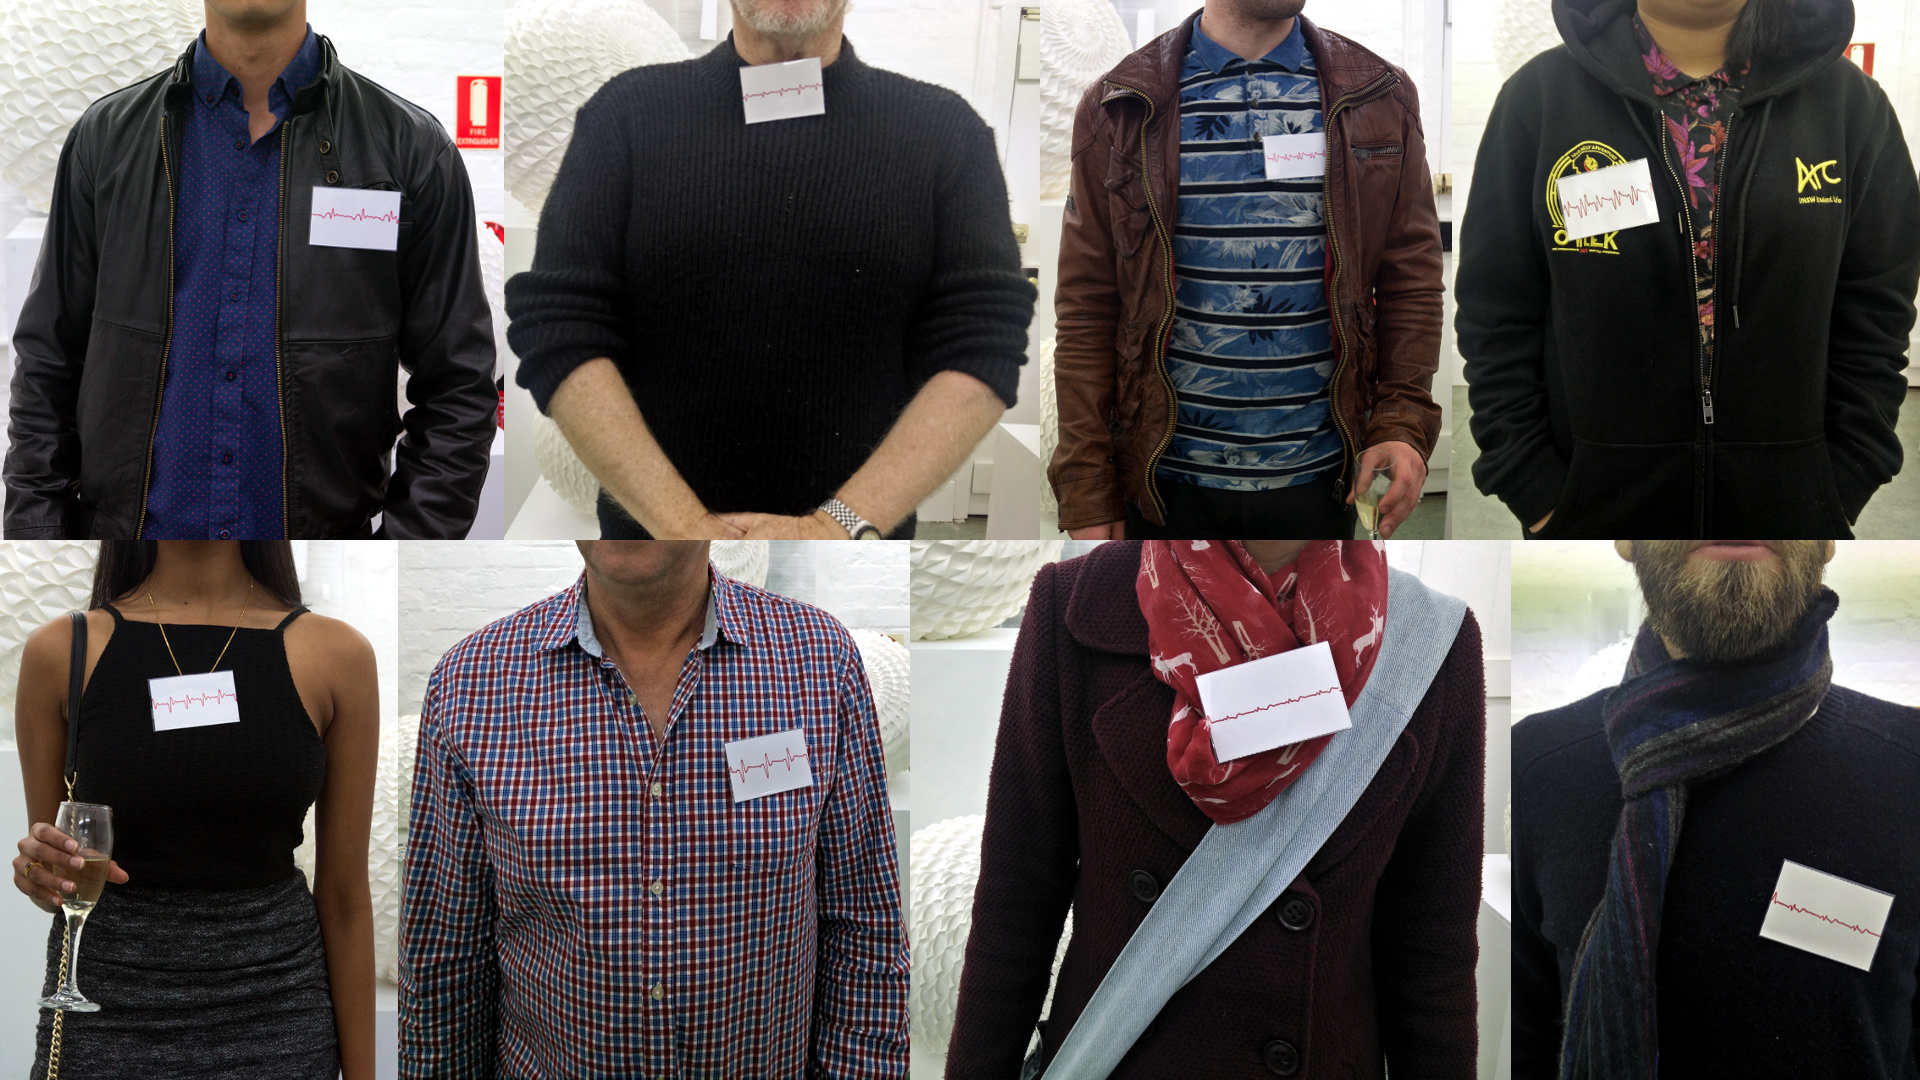
Anyway, the end result worked great and didn't kill anyone. I set the plotter up on a whiteboard, using plain office paper to do practice runs and then drawing the real thing on perforated ID badge inserts. The whiteboard being metallic meant I could use magnets to hold the cards in place while the plotter did its thing. With one other operator fitting the electrodes and me lining up the cards for the plotter, things proceeded quite quickly; about 1-2 minutes per person, but I think we could have hit 30 seconds if we needed to.
The social element went even better than I anticipated. I figured the individual differences in heart rate and morphology would make for an interesting and distinct signature for each person, but I didn't realise how striking the differences in amplitude would be. Some participants had big, sweeping waves that took up most of the badge. Others had little more than a wiggly line. These were normal variations (I believe mostly due to differences in body resistance), but they turned out to be the most noticable.
The people with very small waves took to calling themselves "flatliners" and commiserated together. One lady had an abnormally fast heart rate, which started a conversation about her heart condition and ongoing treatment. A few people came back later in the night to see if drinking had changed their graph much (it was about the same). People with particularly photogenic graphs got a lot of compliments, in a curious twist on the genetic lottery. Only one person declined; she'd had a scary ECG result before that turned out to be nothing, and didn't want to worry about what she'd see this time.
One of the most curious things about medicine is the way it turns people into data. Doctors aren't looking at you; they're looking through you to see what's wrong with your numbers. My goal with this project was to make that part of the conversation. What happens when you wear your heartbeat like a signature on your chest, putting your vital numbers on display for everyone to see?
It definitely made for some unique social experiences, but really drove home the tyranny of physical characteristics and the rapid onset of pseudoscience. In a nearby possible world, is it so hard to imagine the flatliners being stereotyped as wimpy and effete? Or looking for one weird trick to boost your cardiac amplitude? Or Ask Einthoven: I'm a regular dating a flatliner, can it work? The worst thing is, these aren't qualities you can develop, they're facts about you that you can't change.
Even if we restrict ourselves to the real universe and real science, we're not so far from a situation where DNA sequencing, facial recognition, social media, targeting databases and real name policies converge to eliminate the possibility of forging our own identities, leaving us with just one bio-authenticated persona, an indelible history tied to our very cells. The computer scientist part of me can see that this is quite clever, but the human part is horrified.
If you'd like to take a look at the code for this project, you can find it on GitHub, or check out my prototypes from July and August to see some drafts along the way.