Mind Music
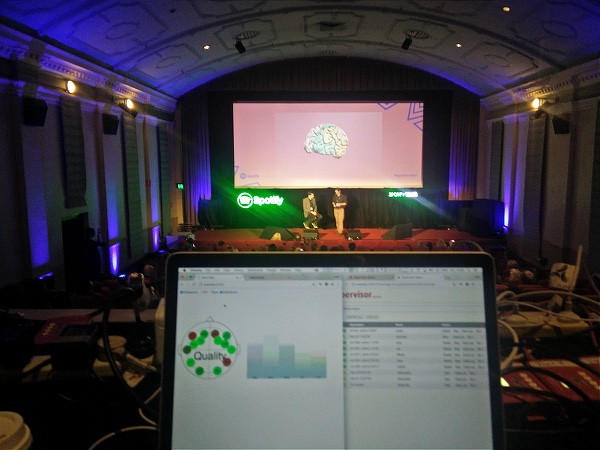
This is a writeup for my work on Mind Music, a presentation at the inaugural Spotify Talks Australia. The talk was presented by Professor Peter Keller of the MARCS institute at Western Sydney University, organised by my friend and previous collaborator Peter Simpson-Young, and included a live visualisation/sonification of brain activity I built based on my prior Project Brain work.
The visualisation/sonification had two parts: one that would show general brain activity, and one that would show the brain responding specifically to music, synchronising with the beat in a process known as neural entrainment, sometimes more specifically called steady-state audio evoked potential (SSAEP), or audio steady state response (ASSR). Although the broad strokes of the data processing were similar to Project Brain this new entrainment demonstration had some unique and challenging features.
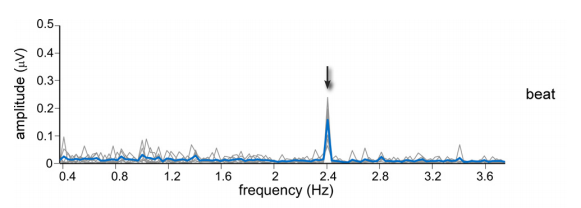
We were attempting to reproduce a particular scientific result from Tagging the Neuronal Entrainment to Beat and Meter by Sylvie Nozaradan et al (pictured). Rather than the previous broad-spectrum visualisation, the goal here was to look for a rhythmic brain response that mirrors the BPM of a particular song. That is, if we're listening to 144 beats per minute, that's 2.4 beats per second, so we should find increased activity at 2.4Hz.
The original paper used data from multiple phase-locked trials averaged together. That is, the same experiment was tried multiple times, but crucially the timing was identical each time. You can imagine the equivalent situation with music: if you play ten copies of the same drum beat at the same time, you get a really loud drum beat; if you play them at different times, you just get an unintelligible jumble.
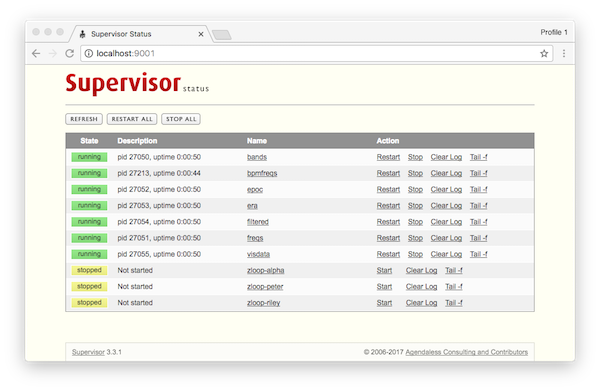
With our demo being live, we couldn't stop and start the recording. Instead, I attempted to come up with a live equivalent of this averaging process, which I called "epoch rolling average", or ERA. An ERA splits the data up into chunks of a certain size and averages them together, with the oldest chunks being discarded as new ones come in. The key part of this is that if the chunk size is a multiple of the frequency in question, then the chunks will end up synchronised with each other without requiring manual synchronisation.
Another difficulty is that the Fast Fourier Transform, used in both the scientific paper and my original visualisation, has some restrictions that made it tricky to work with. It tells you all the different frequencies that make up a signal, but the frequencies are grouped into bins, whose precision depends on how long you collect data for. More data means more bins and thus more precision, but also more latency between when you start collecting data and when you see the output.
Complicating this is that which frequency each bin is centred around is also related to how much data you use. We could pick data sizes so that our frequency would be in the centre of a bin, but the "fast" in "Fast Fourier Transform" requires that we use a a power of 2. We could make up for that by increasing the size until it got precise enough that it was really close, but that would, again, take longer and make it less real-time.
To get around this, I turned to a different kind of Fourier transform technique called the Goertzel algorithm. This is much less efficient than the FFT per frequency, but also allows you to pull out a single frequency at a time. Since in this case we only wanted a few, that meant I could ditch the power-of-2 restriction and make the frequency we wanted fall right in the centre of a bin.
Beyond the technological challenges, there were some interesting new parts to the visualisation. Most of the work for this was done in Unity by Alex Lemon at Rh7thm. I provided a specific data feed for the visualisation that included the colours, animation speed, amplitude and phase for each brain segment, and then he used those parameters to animate a 3d brain model. There was a lot of fine tuning involved, but the end result ended up looking really nice.
As for the sonification, a lot of that was based on my previous pentatonic mapping, but with a lot more tuning to make it sound less shrill and more chill. This pentatonic sonification was used for the first part of the presentation, where we talked about general brain activity, but we also wanted something less ethereal and more rhythmic for the beat detection demonstration.
What I ended up doing was a low bassy frequency with a kind of tremolo and wobble filter on top of it. To make that work properly, I needed to make sure the bass synced with the music, so I had to add some code to cue the music from within the sonification, and only on an even multiple of the beat. I used Web Audio for all of this and, although it got a bit tricky to keep everything orderly with so many components, the flexibility it gave me was totally worth it.
The goal for this ended up being an interesting mix of science and theatre; on the one hand, we were attempting to build on a genuine scientific discovery in an interesting and novel way. On the other, we were there in the spirit of showmanship, trying to make an entertaining audiovisual complement to Professor Keller's presentation.
So how well did we succeed? It definitely wouldn't rise to the level of real science, not least of which because rather than starting with "how do we test a hypothesis?" we were starting with "how do we make something that looks good?" The way the visualisation was designed and tuned basically guaranteed that something would happen, though it would be more intense the better the beat was detected. The signal from our consumer-grade EEG was pretty noisy, and it could be that what we visualised in the end was as much noise as it was neural entrainment. On the other hand, all of the processing we did was legitimate, just not provably so.
But I would say its value as an entertaining and informative visualisation was undeniable. The crowd had a good time, the presentation went smoothly, and the technology all survived a live stage demonstration, despite some terrifying last-minute wireless issues. I had a lot of backup options ready to go in case something failed and, even though I didn't need to use them, having them there really took the edge off the live stage performance.